Data analysis#
# Imports
import cv2
import glob
from utils import *
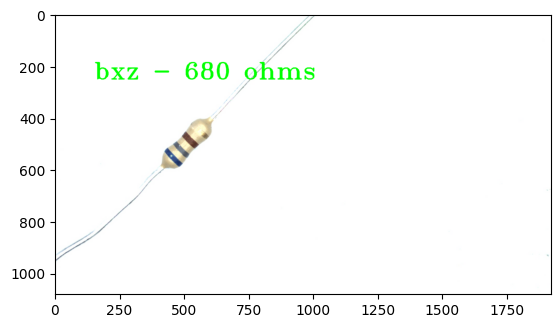
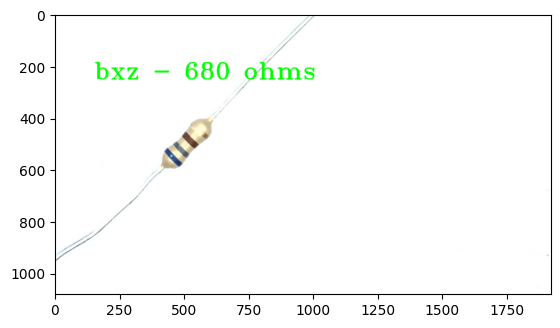
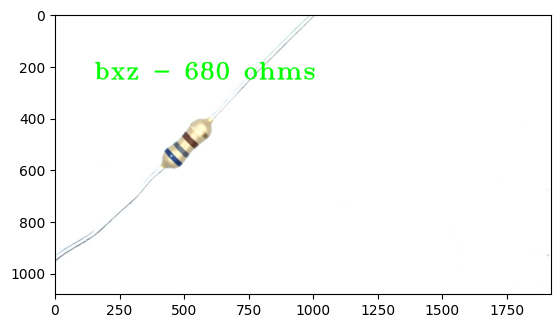
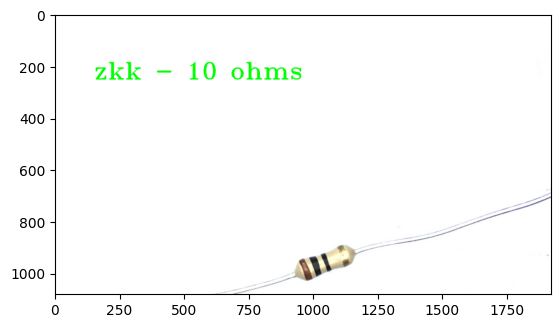
# Loop over every image
for i in glob.glob('../data/resistor_images/*jpg'):
# Read image
image = cv2.imread(i)
# Read label
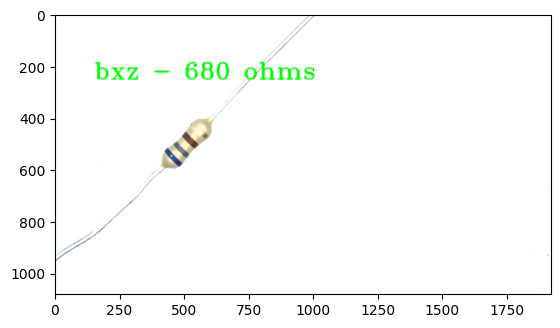
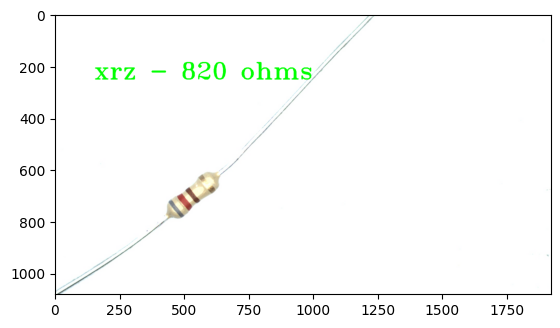
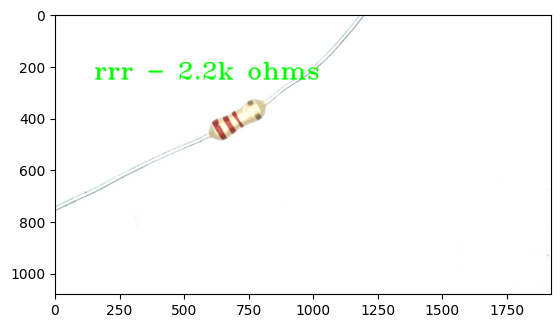
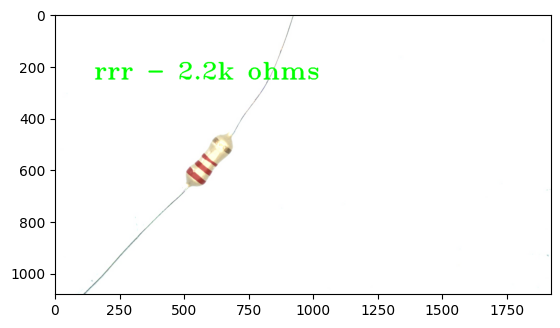
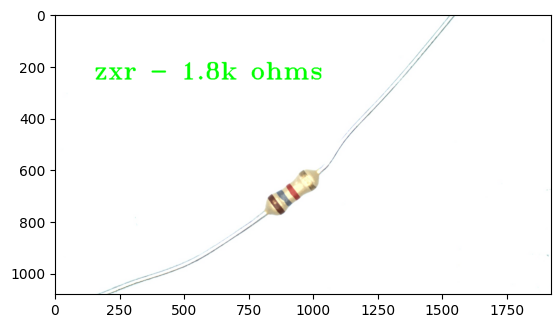
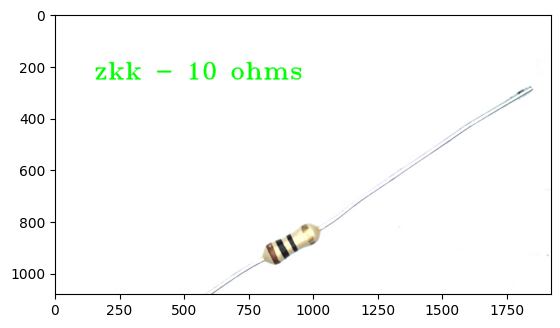
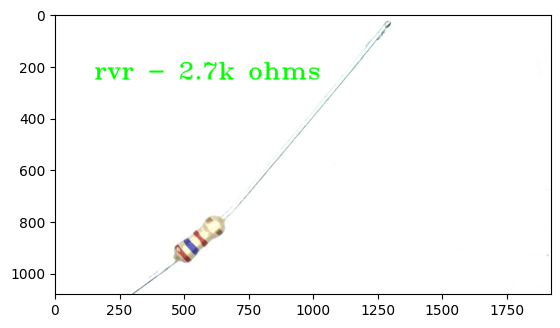
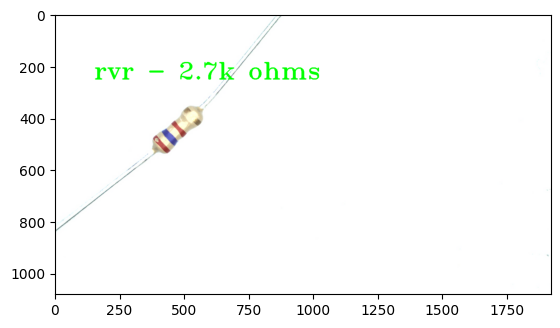
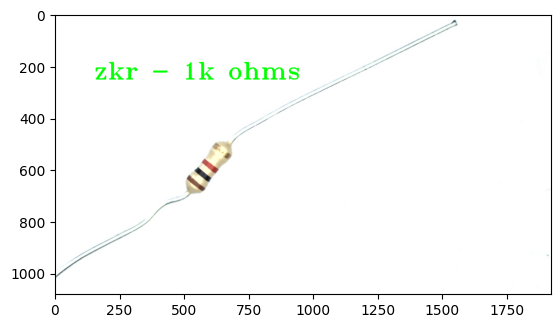
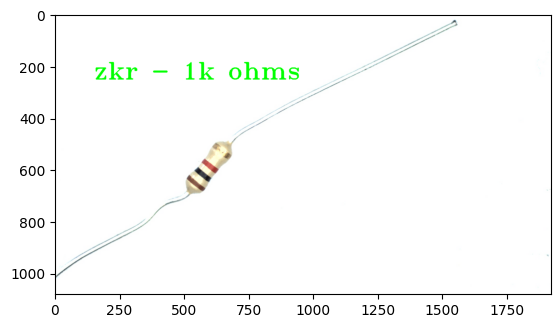
label = i.split('_')[-1][0:3]
# Plot text
cv2.putText(image, text=label + " - " + decode(label), org=(150, 250), fontFace=cv2.FONT_HERSHEY_TRIPLEX, fontScale=3, color=(0, 255, 0),thickness=3)
# Show
plt.imshow(cv2.cvtColor(image, cv2.COLOR_BGR2RGB))
plt.show()